Look out your window and ask yourself this question: If a disaster of some sort — natural or economic — were to hit my neighborhood, how well could my neighbors and I cope with it? Do we have the resources to deal with it? Or, would it be more of a challenge for us than for elsewhere, because of poverty or infrastructure or other reasons?
There is actually an index that measures how vulnerable a location is to damage from a disaster. It's put out by the CDC, and it's called the Social Vulnerability Index (SVI). It takes into consideration socio-economic status, transportation networks, language barriers, and household status (if there are a lot of elderly or disabled residents, for example) to determine how well a community can respond to disasters, either natural or manmade (like a chemical spill or a terrorist attack). The most vulnerable areas are the ones that will be the least resilient and bounce back slower (or not at all) when disaster hits.
So, if you've got an area that is already on the vulnerable end of the SVI index, and you add two more disasters, what do you get? Dr. Neal Turpin decided to create some maps to find out. Look at his maps below to see this indisputable fact:
Southeastern Kentucky is about to find out.
SVI alone
Here is the map showing the Social Vulnerability Index for all counties in Kentucky. The darker the color, the more vulnerable that county is to a disaster, and the longer it will take for that county to recover.
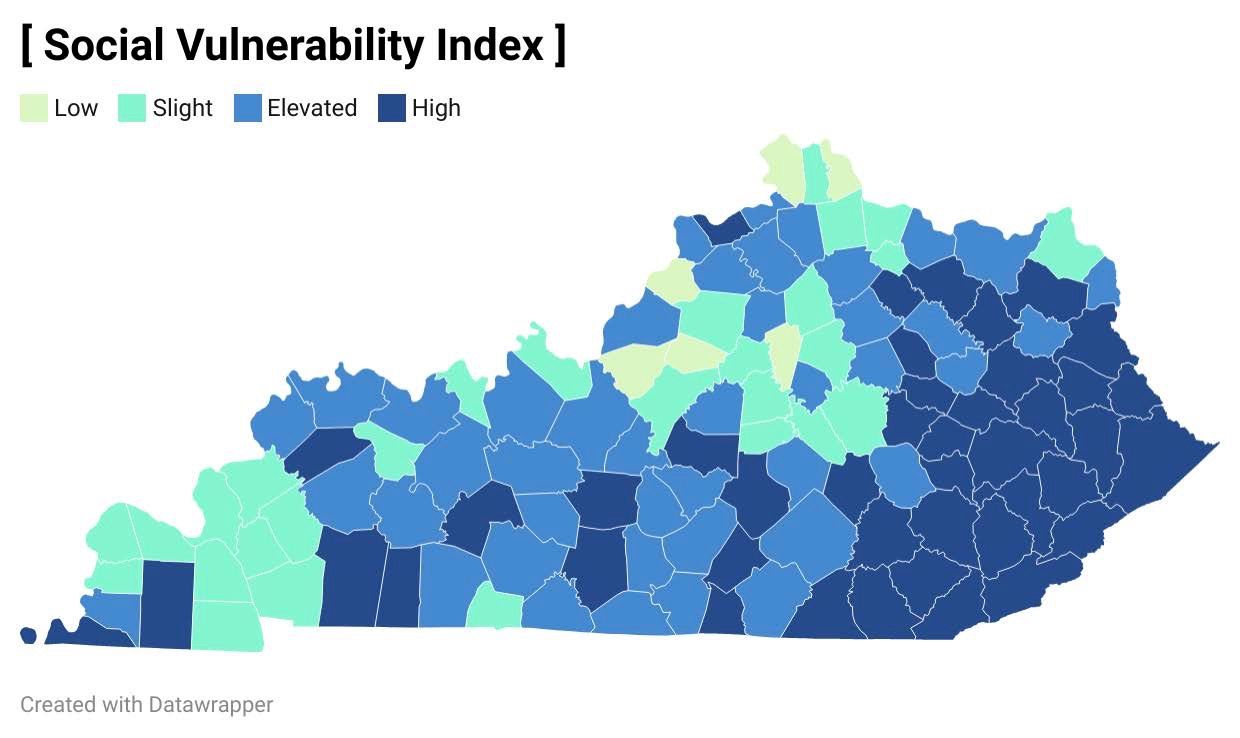
Obviously, there are some counties with challenges all across the state. But as you can also see, the entire southeast part of the state is at either Elevated or High vulnerability. So, those counties are going to have a harder time dealing with a natural or economic disaster.
SVI plus COVID
Do we have a disaster playing out in our state? Of course we do – the pandemic. Not only is it damaging the health of our citizens, it is also affecting our economy and our educational programs. And if your area already has poor health, COVID is going to be worse.
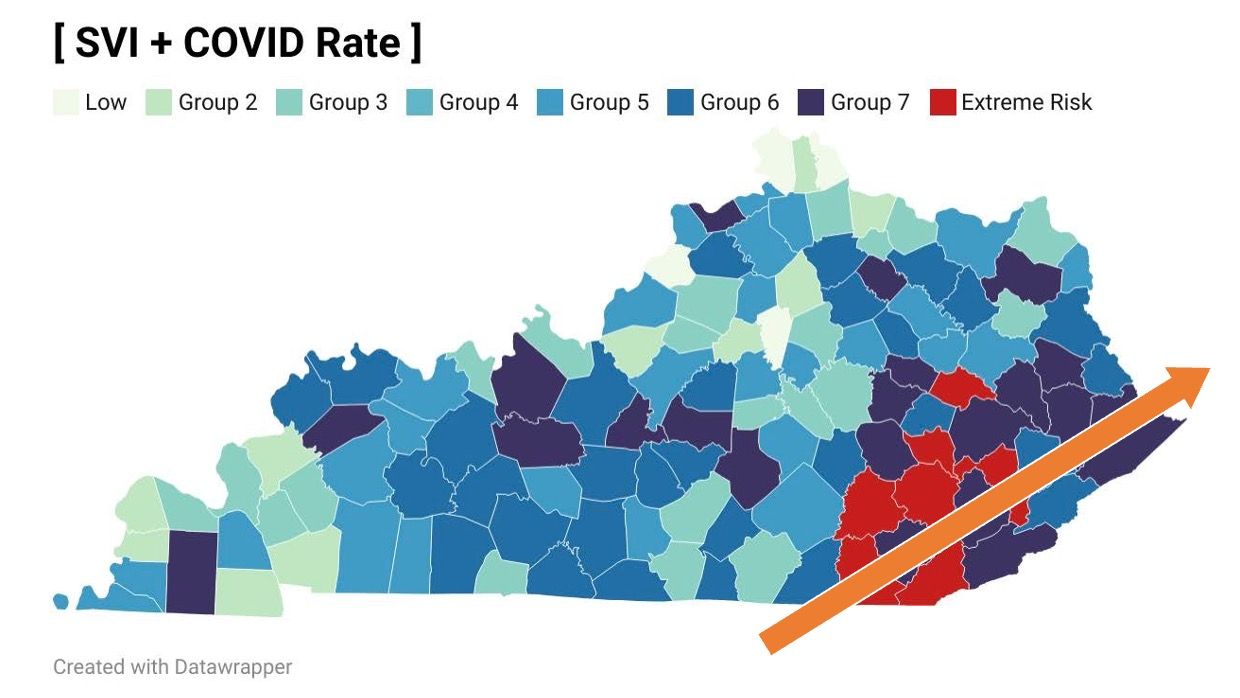
So here's what you get when you combine the SVI map with the levels of COVID across the state:
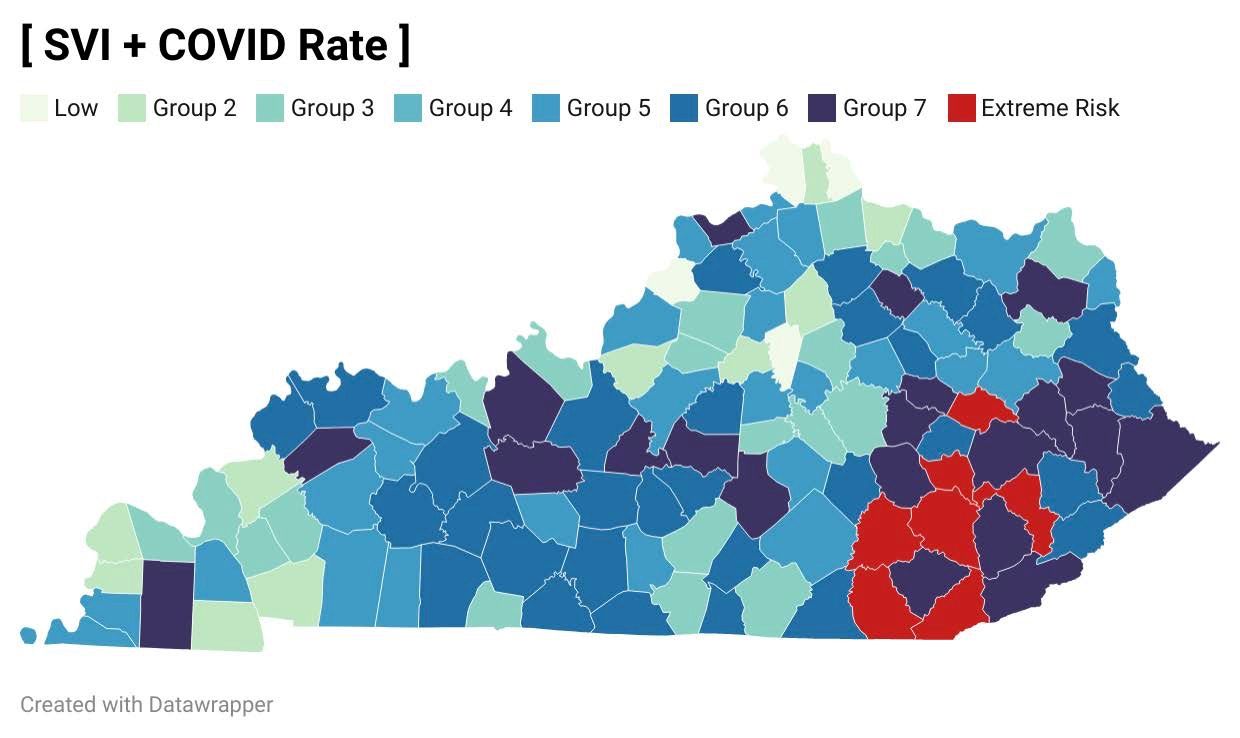
Southeastern Kentucky, already facing economic, health, infrastructure, and educational challenges, now has the surging virus to contend with. As you can see, when you combine SVI with COVID rates, a number of counties are truly, truly in the red.
But wait – we said three impacts. What's the third one? How about – a hurricane?
SVI plus COVID plus Ida
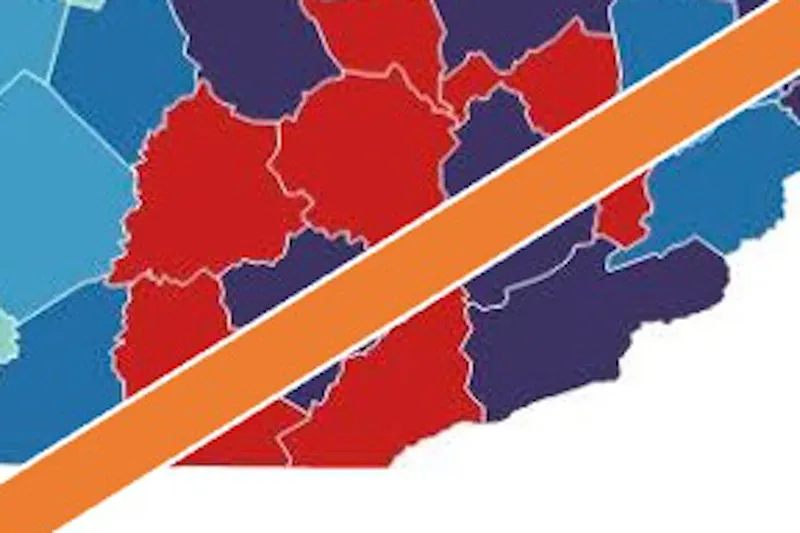
That's right – the remnants of Ida are predicted to hit southeastern Kentucky this week. Here's the above map with the Ida storm track added.
As Dr. Turpin pointed out when he sent me these maps:
It really couldn't get worse for Southeastern Kentucky. They have the highest COVID rates, the highest level of vulnerability in general, and a hurricane is coming. Eastern Kentucky is dealing with flash flooding this morning that has nothing to do with Ida. The ICUs in that region are about 2/3s full. If there's any sort of lapse in power, things will go from downhill to freefall real quick.
As we think about these maps, here are three concluding thoughts:
- This is going to be one of those times when the effectiveness of government, both local and state, is going to be put to the test. Let us hope that all the governments involved are up to the tasks at hand.
- Please keep everyone affected by Ida in your thoughts, but especially the good folks of southeastern Kentucky as they deal with this “perfect storm.”
- And, if you are able, put feet on those thoughts by donating or volunteering to help.
--30--


