


After passing an abortion ban that took effect when Roe was overturned, the Repubs in the Kentucky legislature went for the grand prize: taking the courts out of the picture by amending the Kentucky Constitution. The amendment would have removed any judicial remedies to the increasingly draconian abortion laws in this state, leaving the question of women’s rights and women’s bodies solely in the hands of the very-conservative and very-male legislature.
They failed. The amendment lost.
And in the end, it wasn’t particularly close. With about 88% of the votes in, the No side is leading with 52.6% of the vote. The Yes side would have to get 70% of the remaining votes to take the lead. Could that happen? Statistically, yes. Practically, no.
Where did the No votes come from? As you would expect, from the major cities – but also from some other places across the state. This map shows the vote by county, with darker red meaning more No votes and darker blue meaning more Yes vote.
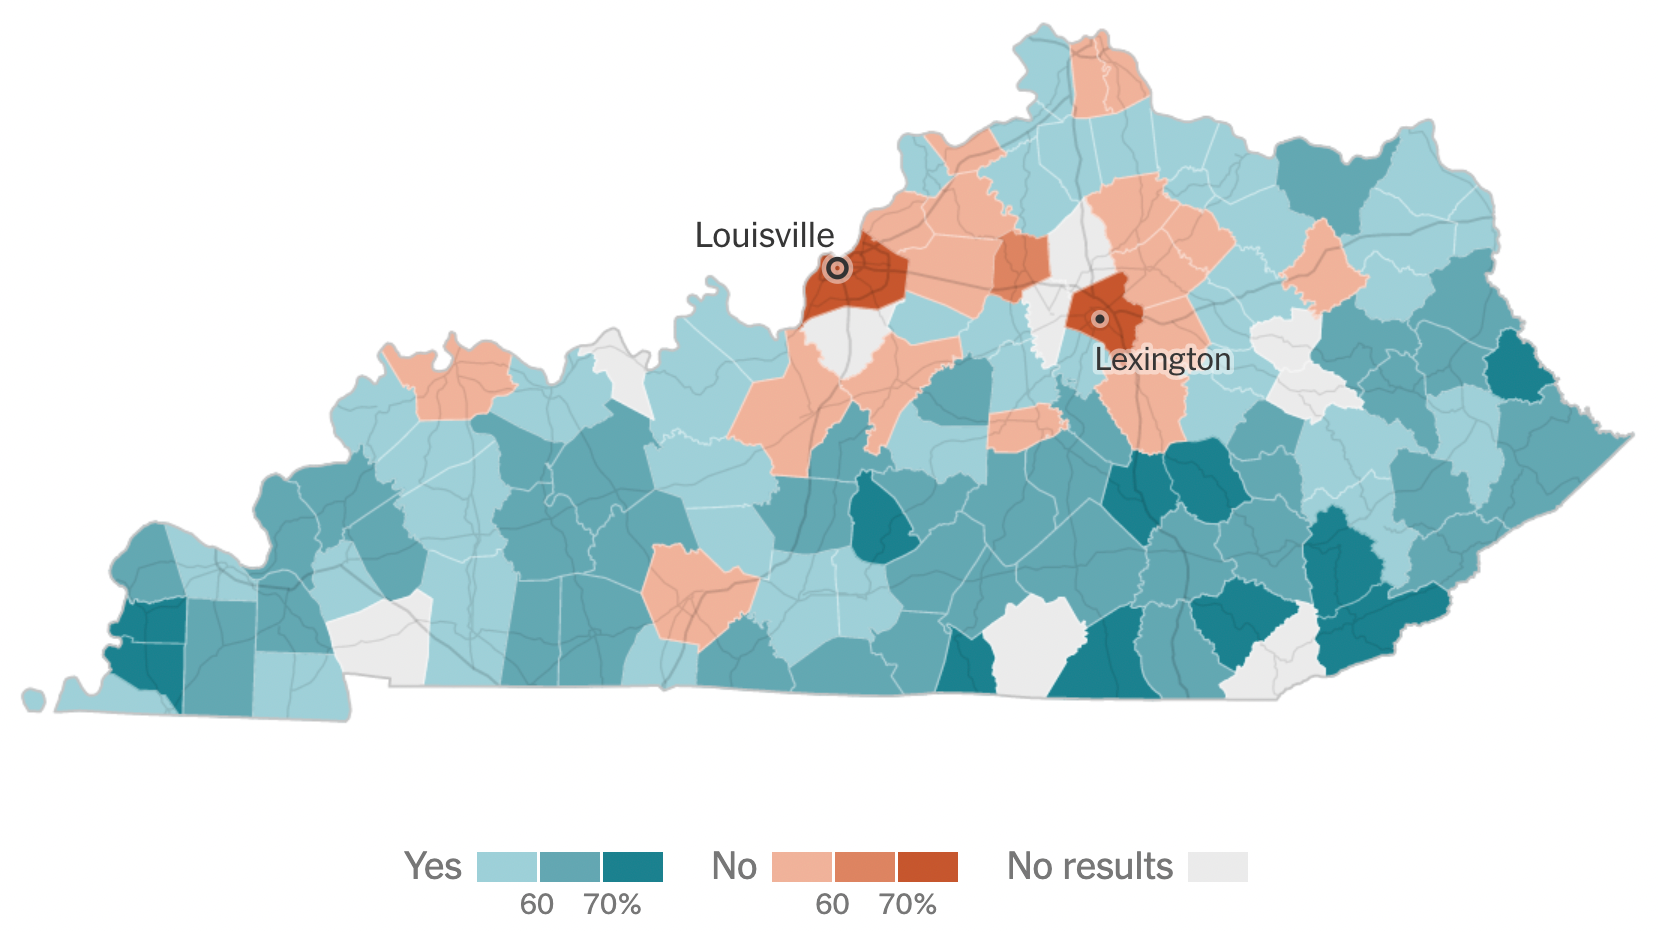
It should be noted that more than one observer has looked at this map and said “Dems, here’s your organizing map for 2024.” (To which I absolutely agree.)
And, for those of you who love digging into the data, here is the vote table from the same NY Times page as of 10:00 AM this morning. Note that the table is sortable by clicking on the column header; to reset it, just refresh the page.
| County | No % | Yes % | Total votes |
Percent of votes in |
|---|---|---|---|---|
| Jefferson | 71 | 29 | 264,780 | >95% |
| Fayette | 73 | 27 | 103,915 | 79% |
| Kenton | 55 | 45 | 49,786 | 75% |
| Boone | 49 | 51 | 44,121 | >95% |
| Warren | 55 | 45 | 37,225 | >95% |
| Campbell | 57 | 43 | 34,315 | >95% |
| Daviess | 46 | 54 | 31,760 | >95% |
| Hardin | 51 | 49 | 29,943 | >95% |
| Madison | 52 | 48 | 29,607 | >95% |
| Oldham | 58 | 42 | 25,899 | >95% |
| McCracken | 46 | 54 | 21,975 | >95% |
| Pulaski | 31 | 69 | 20,566 | >95% |
| Franklin | 67 | 33 | 19,765 | >95% |
| Laurel | 31 | 69 | 17,285 | 75% |
| Shelby | 52 | 48 | 17,261 | >95% |
| Jessamine | 48 | 52 | 16,967 | >95% |
| Nelson | 51 | 49 | 16,290 | 85% |
| Christian | 44 | 56 | 14,425 | >95% |
| Pike | 38 | 62 | 14,278 | >95% |
| Hopkins | 43 | 57 | 14,194 | >95% |
| Boyd | 49 | 51 | 13,448 | >95% |
| Henderson | 54 | 46 | 13,405 | >95% |
| Barren | 45 | 55 | 13,291 | >95% |
| Marshall | 38 | 62 | 12,523 | >95% |
| Greenup | 46 | 54 | 11,701 | 79% |
| Graves | 31 | 69 | 11,580 | >95% |
| Clark | 51 | 49 | 11,509 | >95% |
| Calloway | 48 | 52 | 11,480 | 79% |
| Floyd | 43 | 57 | 11,401 | 83% |
| Boyle | 53 | 47 | 9,981 | >95% |
| Muhlenberg | 37 | 63 | 9,812 | >95% |
| Whitley | 32 | 68 | 9,668 | >95% |
| Meade | 46 | 54 | 9,338 | >95% |
| Anderson | 45 | 55 | 9,165 | >95% |
| Montgomery | 46 | 54 | 8,674 | >95% |
| Taylor | 36 | 64 | 8,517 | >95% |
| Logan | 39 | 61 | 8,073 | >95% |
| Mercer | 44 | 56 | 7,842 | 78% |
| Carter | 43 | 57 | 7,583 | >95% |
| Spencer | 46 | 54 | 7,570 | >95% |
| Grayson | 41 | 59 | 7,486 | 74% |
| Knox | 30 | 70 | 7,390 | >95% |
| Grant | 41 | 59 | 7,190 | >95% |
| Lincoln | 36 | 64 | 7,186 | >95% |
| Rowan | 58 | 42 | 7,128 | >95% |
| Harlan | 26 | 74 | 6,924 | >95% |
| Ohio | 38 | 62 | 6,904 | >95% |
| Perry | 42 | 58 | 6,642 | >95% |
| Bourbon | 58 | 42 | 6,588 | >95% |
| Harrison | 52 | 48 | 6,446 | >95% |
| Adair | 31 | 69 | 5,947 | >95% |
| Russell | 30 | 70 | 5,903 | 79% |
| Hart | 39 | 61 | 5,893 | >95% |
| Henry | 53 | 47 | 5,759 | >95% |
| Garrard | 39 | 61 | 5,738 | >95% |
| Allen | 36 | 64 | 5,730 | >95% |
| Marion | 45 | 55 | 5,605 | >95% |
| Johnson | 33 | 67 | 5,570 | 67% |
| Simpson | 44 | 56 | 5,489 | >95% |
| Mason | 49 | 51 | 5,485 | >95% |
| Letcher | 39 | 61 | 5,421 | >95% |
| LaRue | 38 | 62 | 5,030 | >95% |
| Casey | 30 | 70 | 4,905 | 82% |
| Breckinridge | 43 | 57 | 4,851 | 57% |
| Washington | 39 | 61 | 4,756 | >95% |
| Clay | 30 | 70 | 4,738 | >95% |
| Pendleton | 40 | 60 | 4,673 | >95% |
| Magoffin | 37 | 63 | 4,636 | >95% |
| Fleming | 44 | 56 | 4,629 | >95% |
| Knott | 39 | 61 | 4,617 | 88% |
| Union | 41 | 59 | 4,599 | >95% |
| Caldwell | 35 | 65 | 4,509 | >95% |
| Rockcastle | 26 | 74 | 4,386 | >95% |
| Estill | 43 | 57 | 4,295 | >95% |
| Green | 26 | 74 | 4,193 | >95% |
| McCreary | 27 | 73 | 4,055 | >95% |
| Butler | 35 | 65 | 3,988 | >95% |
| Webster | 40 | 60 | 3,960 | >95% |
| Edmonson | 44 | 56 | 3,953 | >95% |
| Bath | 50 | 50 | 3,871 | >95% |
| Lawrence | 34 | 66 | 3,851 | >95% |
| Owen | 41 | 59 | 3,725 | >95% |
| Morgan | 34 | 66 | 3,703 | >95% |
| Metcalfe | 44 | 56 | 3,681 | >95% |
| Lewis | 35 | 65 | 3,531 | >95% |
| McLean | 37 | 63 | 3,487 | >95% |
| Breathitt | 41 | 59 | 3,427 | 73% |
| Jackson | 17 | 83 | 3,415 | >95% |
| Todd | 35 | 65 | 3,259 | >95% |
| Monroe | 30 | 70 | 3,232 | >95% |
| Powell | 47 | 53 | 3,218 | >95% |
| Livingston | 32 | 68 | 3,089 | >95% |
| Lyon | 43 | 57 | 3,075 | >95% |
| Bracken | 42 | 58 | 3,030 | >95% |
| Trimble | 48 | 52 | 3,005 | >95% |
| Ballard | 34 | 66 | 2,992 | >95% |
| Clinton | 25 | 75 | 2,992 | >95% |
| Crittenden | 33 | 67 | 2,983 | 83% |
| Gallatin | 48 | 52 | 2,802 | >95% |
| Leslie | 29 | 71 | 2,723 | 70% |
| Carroll | 54 | 46 | 2,698 | 80% |
| Martin | 30 | 70 | 2,359 | 77% |
| Nicholas | 60 | 40 | 2,275 | >95% |
| Cumberland | 32 | 68 | 2,194 | >95% |
| Carlisle | 29 | 71 | 2,054 | >95% |
| Lee | 40 | 60 | 2,015 | 83% |
| Elliott | 41 | 59 | 1,937 | 79% |
| Fulton | 45 | 55 | 1,489 | >95% |
| Owsley | 34 | 66 | 1,478 | >95% |
| Hickman | 30 | 70 | 1,448 | >95% |
| Robertson | 47 | 53 | 922 | >95% |
| Bell | 0 | 0 | 0 | 0% |
| Bullitt | 0 | 0 | 0 | 0% |
| Hancock | 0 | 0 | 0 | 0% |
| Menifee | 0 | 0 | 0 | 0% |
| Scott | 0 | 0 | 0 | 0% |
| Trigg | 0 | 0 | 0 | 0% |
| Wayne | 0 | 0 | 0 | 0% |
| Wolfe | 0 | 0 | 0 | 0% |
| Woodford | 0 | 0 | 0 | 0% |
Comments