

The Daily Yonder has been following the vaccination story across all rural counties in the United States. They regularly publish maps and data about current COVID statistics in all counties, both metro and rural. (They have a system for distinguishing between "metro" and "rural" counties, which you can read on their web site.)
One of the things they track is vaccination rates by country for the entire country, from which they do some great maps. Recently, they noted some interesting stats about rural vaccination rates:
 Tim Marema
I thought "Great!" Then I decided to dig into the data, so I downloaded their spreadsheet and pulled out just the Kentucky data. And my enthusiasm cooled – quite a bit, in fact.
Yes, the RATE of vaccinations have been rising in many counties. But the PERCENTAGE of people that are actually vaccinated is still horribly low across Kentucky, in both metro and rural counties.
The number that Daily Yonder is tracking is "percent vaccinated" in a given county. This is against the entire population of the country, including children, so of course it will never get to 100%. Getting 70% of everyone vaccinated in a county would mean almost all the adults were vaccinated. So, you've got to start with that in mind.
Even so, the national average for percent vaccinated is over 50%. Over half of all the people in the country have been vaccinated, which is pretty good. (Not great; just pretty good.)
But out of the 120 counties in Kentucky, 106 of them are below the national average in vaccinations. And 32 of them are WAY below the national average.
Here are three maps showing vax rates by county.
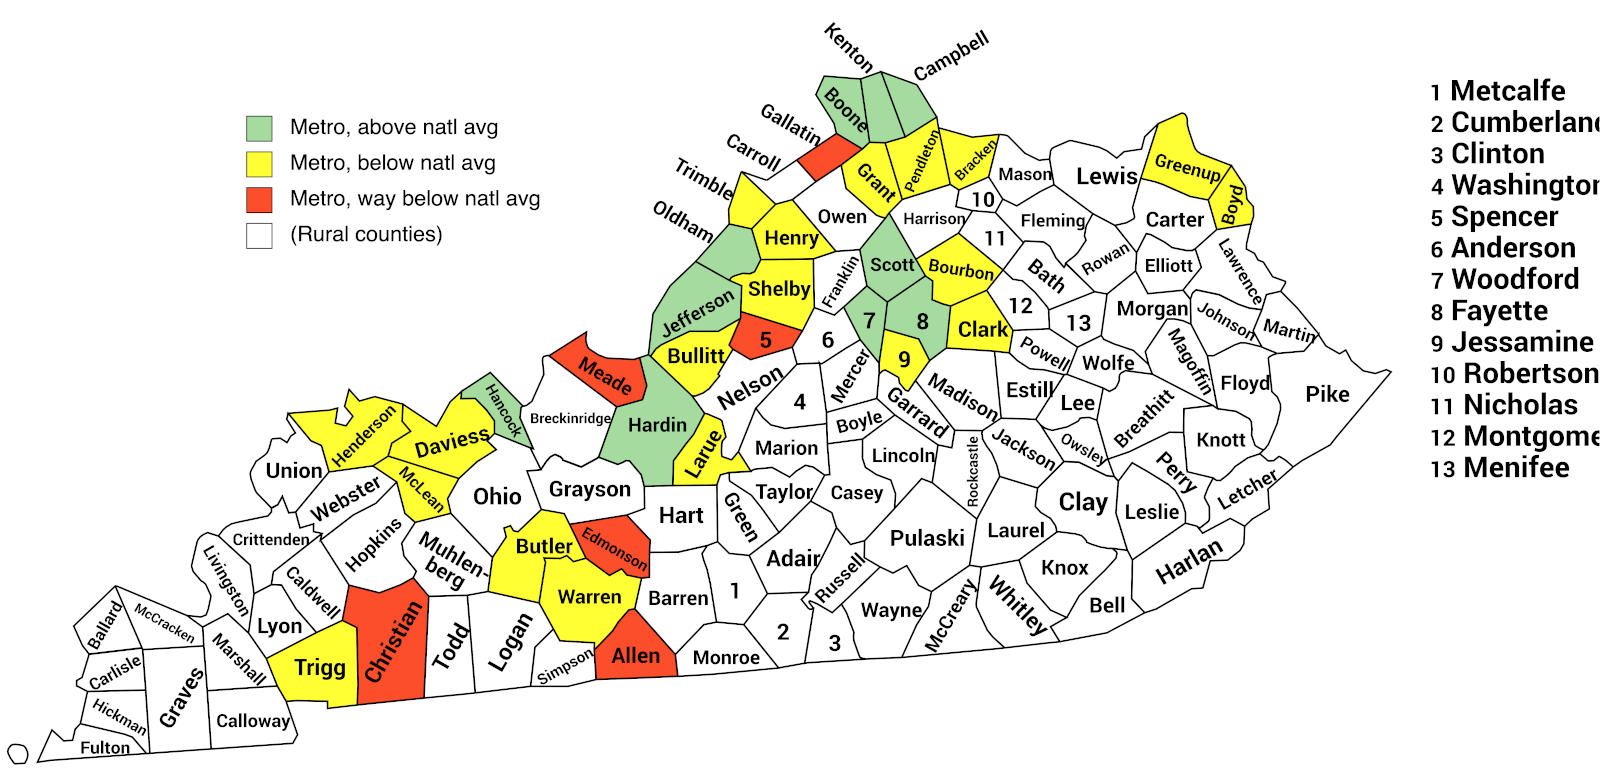
Vaccination rates in Metro counties
Here are the counties the Daily Yonder classifies as "metro" and their vax rates. The "way below" is for counties that only have about 35% (or even much lower) of their population vaccinated.
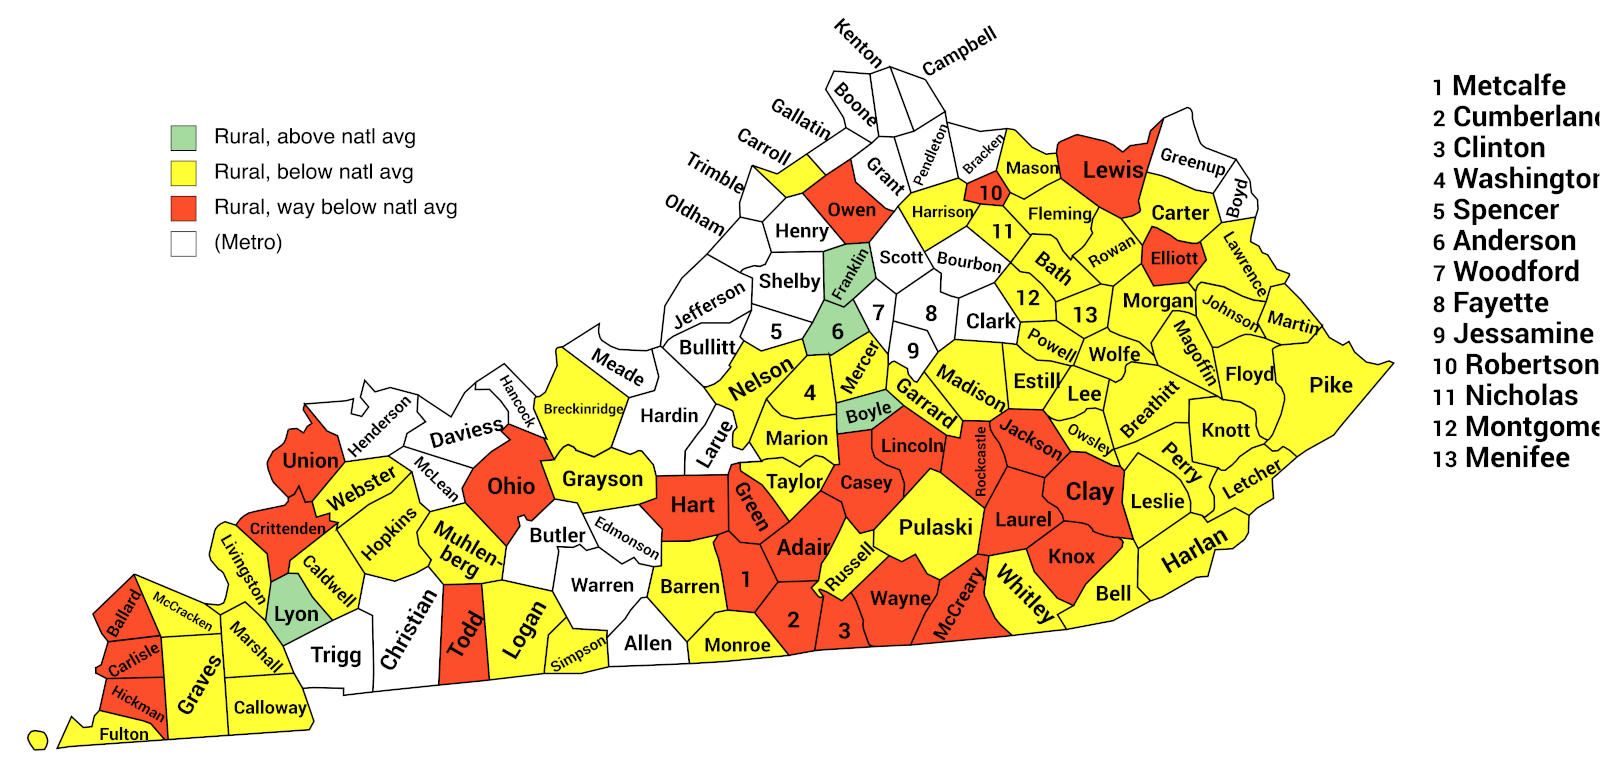
Vaccination rates in Rural counties
Here are the counties the Daily Yonder classifies as "rural" and their vax rates. Again, the "way below" is for counties that only have about 35% (or even much lower) of their population vaccinated.
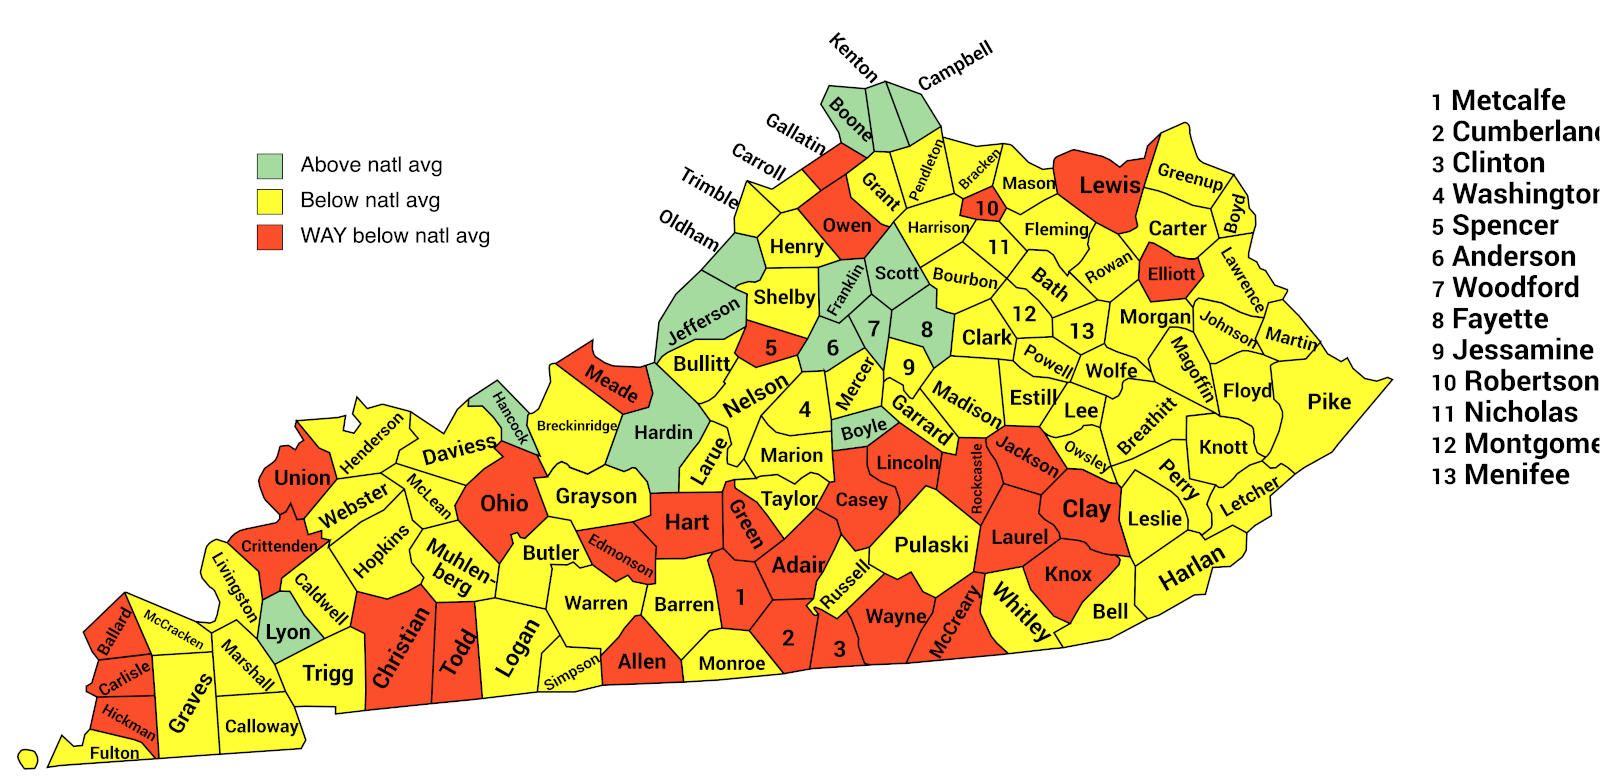
Vaccination rates for entire state
And, for those who want to see the whole picture, here are all the counties on one map.
The bottom line
- The overall vaccination rate in the green counties is 58.3%, above the national average of 50.5%.
- The overall vaccination rate in the yellow counties is 43.3%, well below the national average.
- And in the red counties, the overall vaccination rate is 31.6%, which is horrible.
It's time for the elected leaders in these counties to start acting like leaders and get people to get the shot. Get your numbers out of the 20s and 30s and 40s, and protect your children and your young people.
Because if you don't, not only will your numbers suck – YOU will suck as a public servant, and as a leader in your community.
--30--


