
After the 2019 and 2020 elections, Republicans are dominant in state politics. They now control 75 of the 100 seats in the state House, 30 of the 38 of the seats in the State Senate, and all but 1 (governor) of the 6 elected statewide offices.
This is an article about the Kentucky House. (I will do a subsequent story on the State Senate). Democrats in Kentucky controlled the House for 95 years, but Republicans finally gained control in the 2016 election cycle, climbing from 47 seats to 64 seats. Democrats won back a net of 1 seat in the 2018 midterm, but then Republicans netted 13 more seats in 2020 (note there were also several special elections during this time due to retirements and other circumstances) for a total of 75 now.
There are two big narratives here worth exploring, (1) the overall shift from 2016-2020 was heavily in favor of the GOP in terms of state House races, but (2) Democrats did better in 2018 (when Trump wasn’t on the ballot), which suggests that they might be able to make up some lost ground in next year’s elections. Something else to pay attention to is the urban-rural divide.
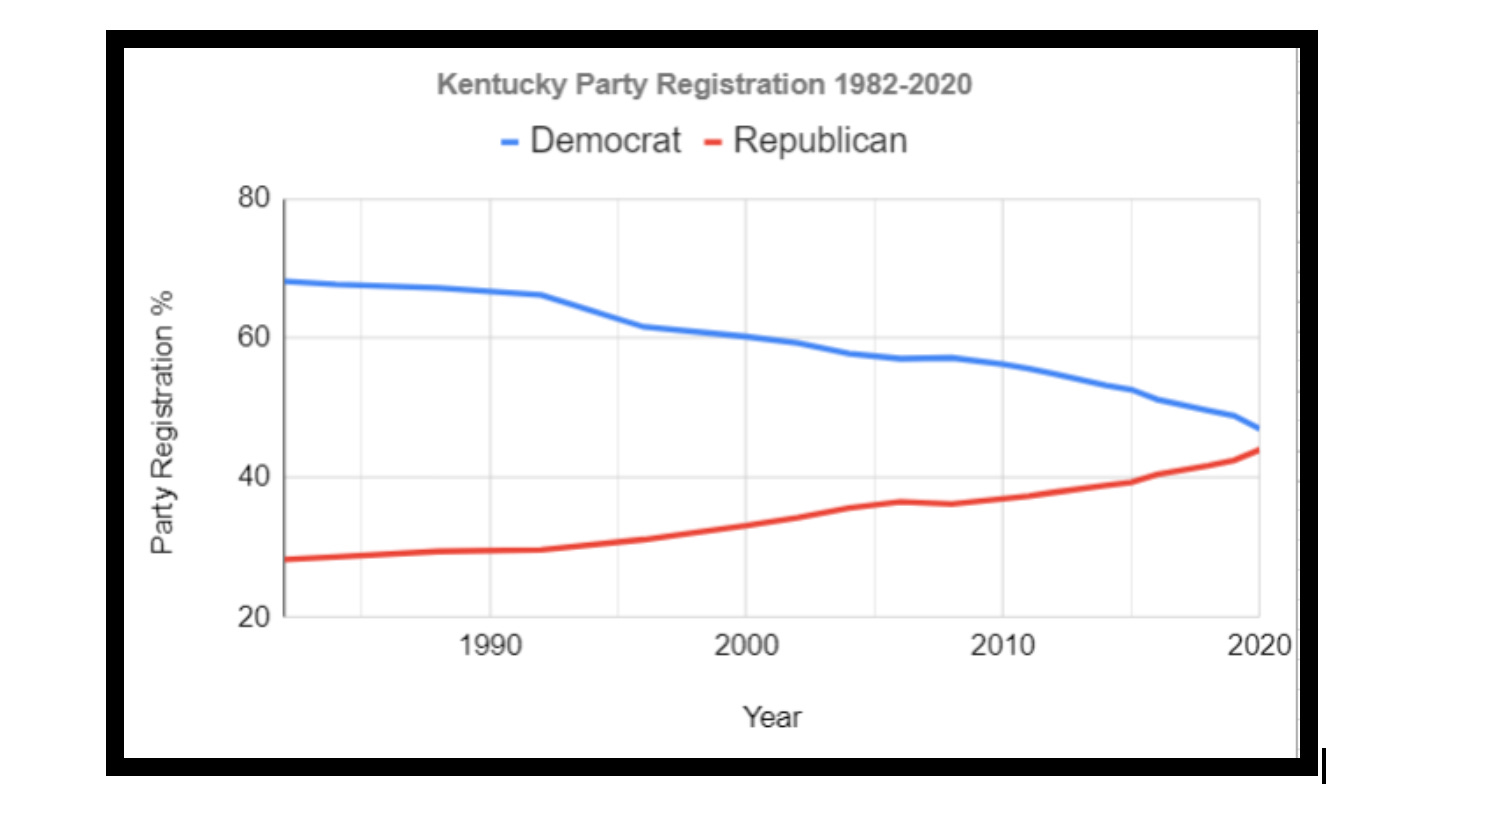
Voter registration in Kentucky has consistently shifted away from Democrats over the last 40 years (see below). So, what does that mean as we look into the future of Kentucky politics, particularly into a post-Trump 2022 midterm election?
For this project, I compare 2016 and 2020 Kentucky state House results by dividing Kentucky into 8 regions:
- Western Kentucky (WKY)
- Central Kentucky (CKY)
- Louisville-greater (LOU-G)
- Lexington-greater (LEX-G)
- Northern Kentucky (NKY)
- Eastern Kentucky (EKY)
- Plus 2 subsets of the urban centers, Louisville (LOU), Lexington (LEX).
Why? It’s important to compare 2020 to 2016 because they were not only recent presidential election years, but recent Trump presidential election years, and Trump has been popular in Kentucky, winning by 30% in 2016 and 27% in 2020. It is likely that the 2020 success of Republicans in the state House is primarily a function of the “Trump effect.” I will then look at the 2018 midterms vs. 2016, as this may be helpful in looking forward to 2022. While what constitutes these geographic regions of Kentucky could be debated at length. I’ve used my judgment in this categorization. The Western Kentucky region includes 23 districts, Central Kentucky 16 districts, Louisville-greater 20, Lexington-greater 11, Northern Kentucky 10, and Eastern Kentucky 20. Note, the aforementioned subsets of Lexington and Louisville include districts only within the county, excluding districts that crossed county lines. (Jefferson County has 15 districts inside Jefferson County and Fayette has 6 districts inside Fayette County).
First, I will provide a brief review of each region with focus on examining the shift from 2016-2020. When calculating average trends of each region, I only used contested races (as some years had no opponents).
We will first take a look at Western Kentucky (WKY). Of the 23 WKY districts, 4 seats flipped from Democrat to Republican over the 2016-2020 period (HD3, HD6, HD11, and HD23). None flipped from Republican to Democrat. If you take the average trend of all contested WKY races from 2016 to 2020, it is 17% more Republican than it was in 2016. HD20 (Minter) is the only remaining state House Democrat in western Kentucky.
Central Kentucky (CKY) – Of the 16 CKY districts, 1 seat flipped from Democrat to Republican (HD27); none flipped to Democrat. The average trend for all contested races in this area is +13% Republican. Derrick Graham (HD57) is the only CKY Democrat in the state House (Note, Lexington and Louisville are not included in the classification of CKY because they have their own classifications).
Louisville + Louisville-Greater Districts (LOU-G) – Of these 20 districts, 1 seat flipped from Democrat to Republican (HD48). None flipped to Democrat. The overall average trend in the area is +4 for Republicans.
Jefferson County (LOU) – However, if you use districts located fully inside Jefferson County, the overall trend is +7 for Democrats.
Lexington + Lexington-Greater Districts (LEX-G) – Of the 11 districts, 3 seats flipped from Democrat to Republican (HD39, HD56, HD72) and 1 district flipped from Republican to Democrat (HD88). The average trend is +16 Republican.
Fayette (LEX) – However, if only districts located fully inside Fayette County are used, the trend is +7.5 Democrat. The more urban areas (HDs 45, 75, 76, 77, 79, 88) have gotten bluer over time and the more rural areas (HDs 39, 62, 72, 81) have gotten redder.
Northern Kentucky (NKY) – 1 seat flipped from Democrat to Republican (HD47). NKY does not have enough data when comparing 2020 to 2016 because only one race was contested both years. Buddy Wheatley (HD65) and Rachel Roberts (HD67) are the only Democrats in the NKY state House.
Eastern Kentucky (EKY) – Of the 20 districts in EKY, 5 seats flipped from Democrat to Republican (HDs 70, 87, 93, 99, and 100), and one from Republican to Democrat (HD95). The average overall trend in this area is +26 for Republicans.
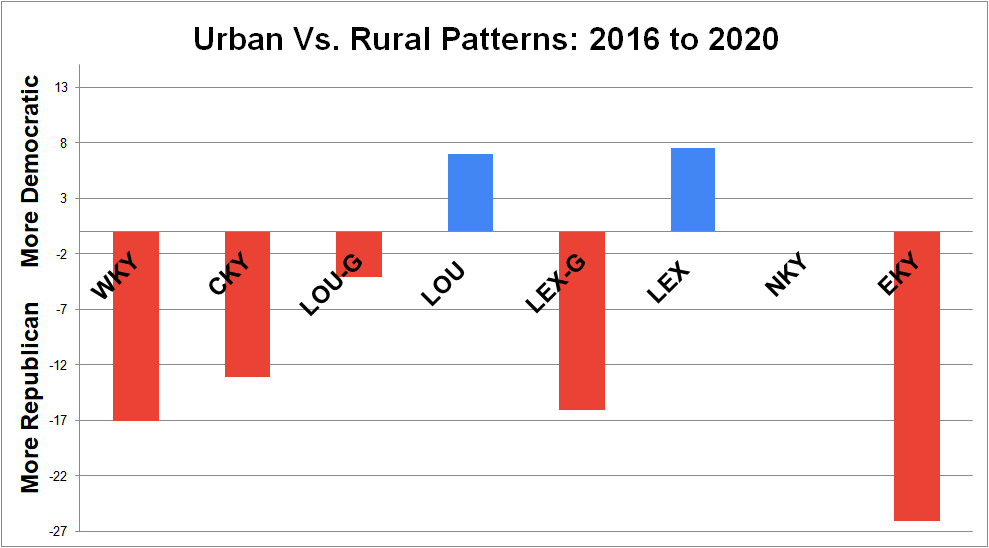
In 2020, a year that some predicted would be a wash for the state House, and one in which the Democratic presidential candidate did well nationwide, there were 13 net pickups for Republicans (and 2 in the state Senate). As a quick summary, the averages by region of the 2016-2020 shift are listed below. Note (in the bullet points and chart below) how areas outside Lexington and Louisville got redder from 2016 to 2020, while Lexington (Fayette County) and Louisville (Jefferson County) grew bluer.
- WKY became +17% more Republican
- CKY became +13% more Republican
- LOU-greater became +4% more Republican
- LOU (only Jefferson) became +7 more Democrat (though there’s limited data on contested races)
- LEX-greater became +16% more Republican
- LEX (only Fayette) became +7.5 more Democrat (though there’s limited data on contested races)
- NKY does not have enough data points (but if you use the 1, it is +5 more Republican)
- EKY became a whopping +26% more Republican
Outside of major urban areas, most of this sounds like terrible news for Democrats, but what about changes from the 2016 election to the 2018 midterms. This actually benefited Democrats and led to a net gain of 1 seat.
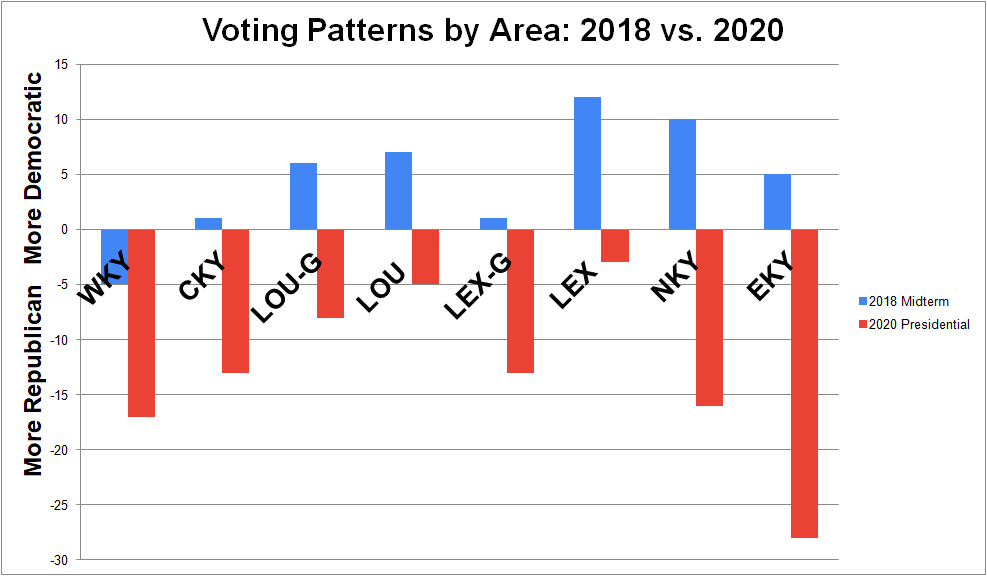
- WKY became +5% more Republican
- CKY became +1% more Democrat
- LOU-greater became +6% more Democrat
- LOU (only Jefferson) became +7% more Democrat
- LEX-greater became +1% more Democrat
- LEX (only Fayette) became +12% more Democrat (though there’s limited data on contested races)
- NKY became 10% more Democrat (though there’s limited data)
- EKY became a +5% more Democrat
Now let’s compare this to the 2020 results (see chart below). Overall, based upon this time period, Democrats are favored in midterm years (especially urban areas), while Republicans are strongly favored in recent presidential election years, especially in rural areas.
Because the 2018 midterm saw gains for Democrats, and because Trump won’t be on the ballot in 2022, could the next midterm be more like 2018? Kentucky voter registration will likely continue to trend Republican overall, but state-level Democrats may have an opportunity to retake some seats they narrowly lost in 2020. Will it be as many as they lost in 2020 (13 state House seats and 2 state Senate seats)? Probably not, but given that Democrats lost 9 races in 2020 by less than 10% (HDs 48, 45, 56, 10, 33, 13, 100, 11, and 8), and because, in theory, 2022 should be a better political landscape, I expect they will be eyeing these seats (see table below), and possibly more.
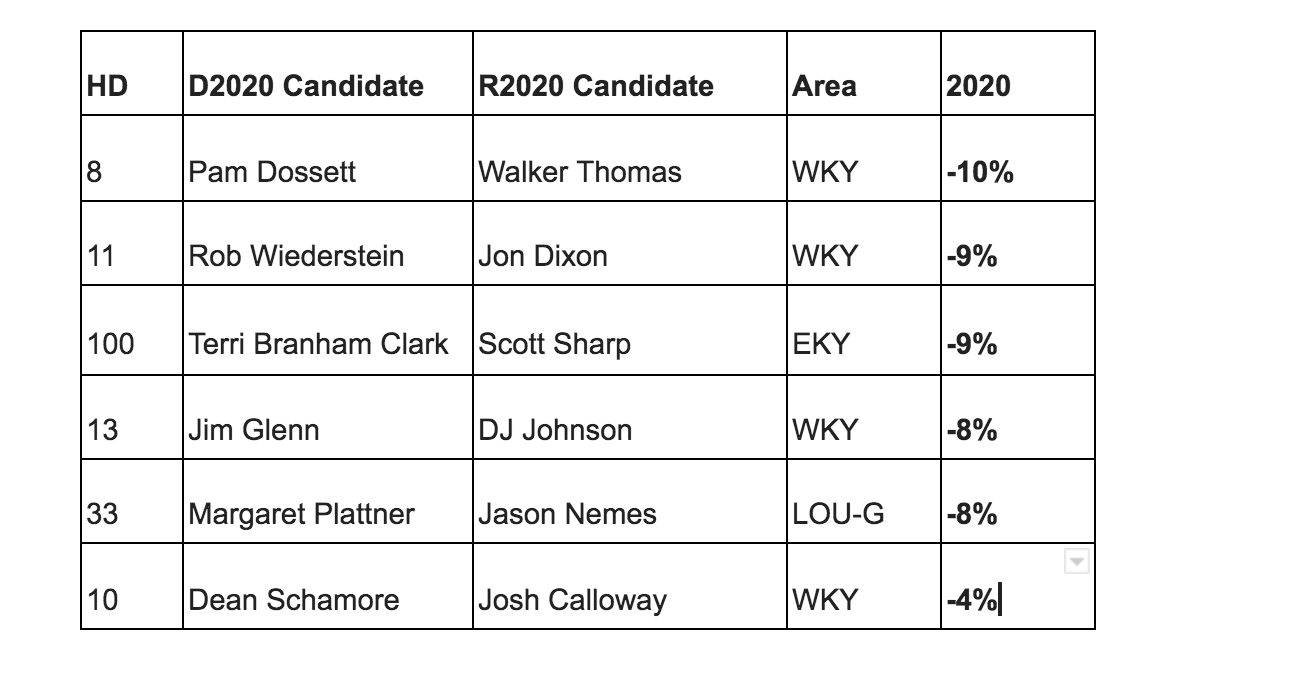
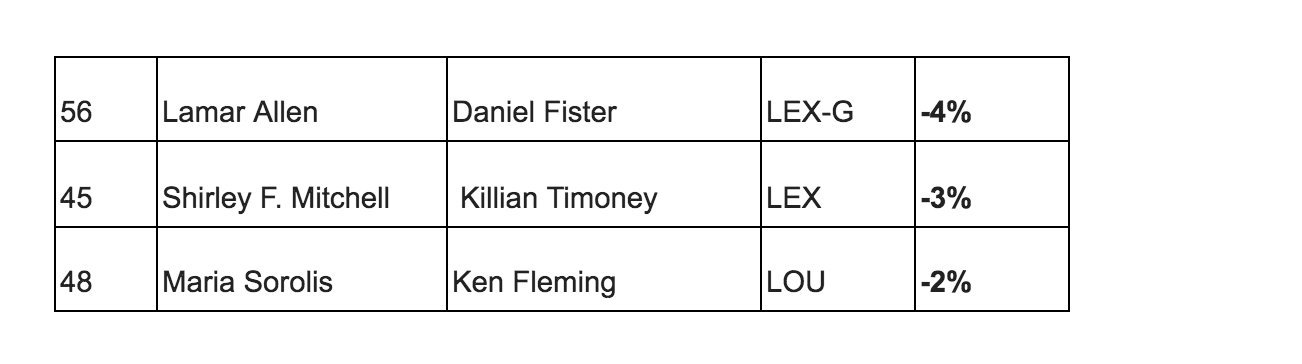
Other considerations: Voter turnout in recent midterm election years in Kentucky averages ~48% while presidential years average ~60%. An unpopular Bevin (R) was in office in 2018 and now a more-popular Beshear (D) is in office; Biden will also have been in office for a while and there will be unpredictable events. Will urban areas continue to grow bluer and rural areas redder? Ariana Velasquez, who serves on the State Central Executive Committee of KDP and is a contributing writer at Forward Kentucky, says that the quickest and easiest way for Democrats to win back the most seats starts in EKY, where many areas were reliably blue before the numerous retirements in 2020. There were also the narrowly-lost seats in, or near, urban areas in 2020 (HDs 48 by 2%, 45 by 3%, 56 by 4%) as well as some WKY seats that were lost by margins under 10% (HDs 10 by 4%, 13 by 8%, and 11 by 9%). See table above. I know better than to try to predict the future of Kentucky politics, but 2022 will be here before we know it and will give us a glimpse into a post-Trump midterm election in Kentucky.
Written by Dr. Trent Garrison. Special thanks to Dr. Laurent Vesely for the helpful advice. Note, this was an extensive research project so I did not have room here to add all the calculations, charts, and other data. If you’re interested in knowing more about that, you are welcome to contact me at trentgarrison@gmail.com.
https://bluegrassbeat.substack.com/p/how-kentuckys-state-house-got-so
Trent Garrison attended Kentucky State University, where he studied public administration, and then earned a PHD in geoscience from University of Kentucky. Dr. Garrison has taught classes in science policy, served as legislative liaison, and co-hosts several shows/podcasts focused on Kentucky. This is his look at the election trends in the state.